When you want certain constructors, methods or properties out of the debugger scope, you can use the DebuggerHidden attribute, part of the System.Diagnostics namespace. When a member has been marked as DebuggerHidden, breakpoints will not hit for that member.
If you are unaware of this attribute, let's go a step ahead to learn about this attribute and how it works. Continue reading to know more.

The attribute named DebuggerHidden, present in the System.Diagnostics namespace of the mscorlib assembly, allows you to control how a member like constructor, method and properties will get exposed to the debugger.
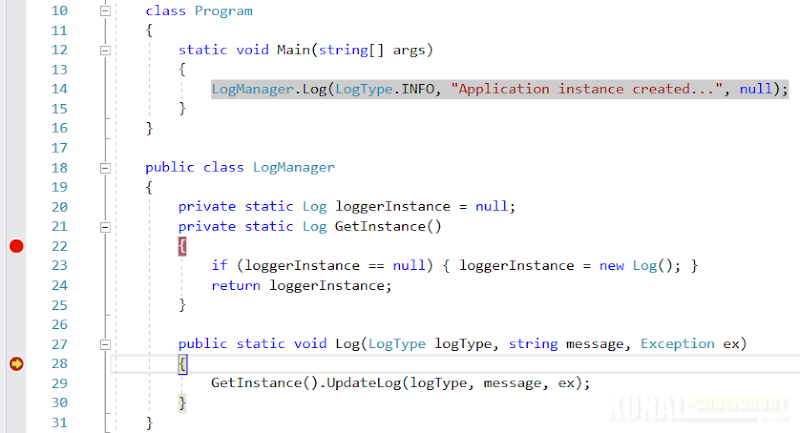
In general, when you put a breakpoint in any code, the debugger breaks at that line. For example, consider the following example where two breakpoints have been added. When you run the code, the breakpoint will first hit the Log method of the LogManager class.

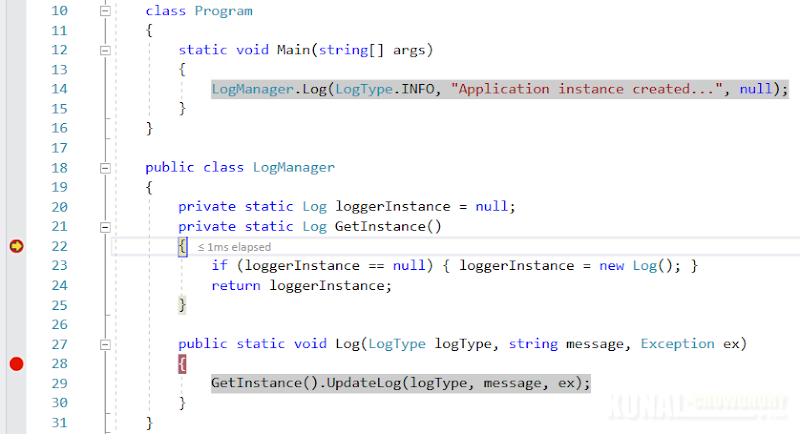
When you continue debugging, or press F5, the next breakpoint which is added in the GetInstance method of the LogManager will hit, as shown in the following screenshot:

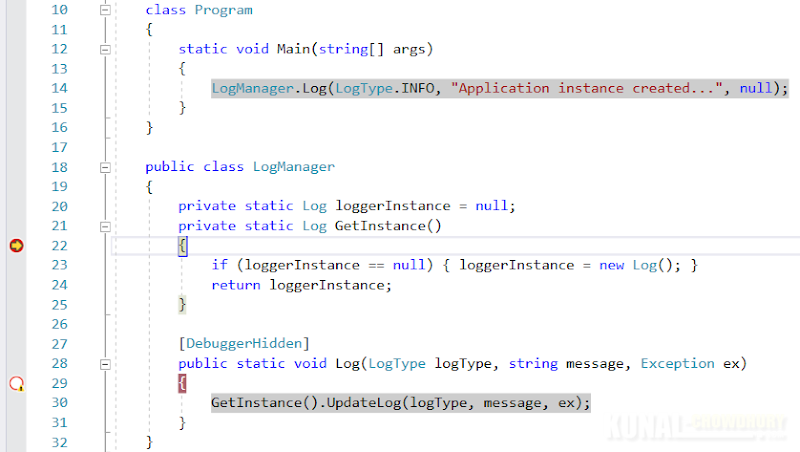
This is default behavior of the Visual Studio debugger. Now if you mark the Log method of the LogManager class with the attribute DebuggerHidden, as shown in the below screenshot, you will see that the breakpoint present in the Log method will not hit:

If you observe the breakpoints circle, in the left panel, you will see that the breakpoint for the Log method didn't load but the other breakpoint which was added to the GetInstance method has been loaded in memory. Also, if you hover over the breakpoint tooltip of the Log method, it clearly states that 'The breakpoint will not currently be hit. Breakpoints cannot be set in method or class with the DebuggerHidden attribute'.
Though, this is not generally needed, but you may need it some time. Hope the post was clear and easy to understand. Let us know, where and why you used this attribute! Cheers!!


