Azure Logic App Monitoring: The Proactive Approach
In this article, you will explore one such Azure Logic App monitoring tool, highlighting the limitations of native Azure Monitor.- Article authored by Kunal Chowdhury on .
In this article, you will explore one such Azure Logic App monitoring tool, highlighting the limitations of native Azure Monitor.- Article authored by Kunal Chowdhury on .
In a real-world integration landscape involving several Azure Logic Apps, addressing issues before they impact critical operations or customer experiences is crucial. Rather than simply responding to incidents after they occur, proactive monitoring empowers us to take preemptive measures and ensure business continuity.
In this article, you will explore one such Azure Logic App monitoring tool, highlighting the limitations of native Azure Monitor in attaining proactive monitoring and a way to resolve them.

Azure Monitor provides built-in monitoring capabilities for Azure resources, including Logic Apps. It offers metrics and alerts for monitoring various aspects of Logic Apps such as execution times, successful runs, failure runs, etc.
App Insights (a part of Azure Monitor) supports dependency visualization and helps in troubleshooting by logging telemetry data. Though they offer basic monitoring and alerting capabilities, there are certain disadvantages to be aware of:
Lack of Consolidated Monitoring: It would be hard to visualize how Logic Apps in an Azure application relate to one another and currently, there is no possibility to monitor the health, performance/availability of multiple Logic Apps in a single alert.
Hard to be Proactive:The absence of warning alerts in Azure Monitor means that you might miss early indicators or potential issues that do not reach the error threshold but still require attention. It limits your ability to proactively address emerging problems before they escalate into big ones.
Insufficient Automation Capabilities: It lacks automation to reprocess failed logic runs. So, you would often require manual intervention to address failed runs, which can be time-consuming and prone to errors.
No Tagging Available: It doesn’t offer tagging capabilities to establish a correlation between the original and resubmitted runs of Logic Apps. This makes it challenging to track the history of runs that are already resubmitted.
Restricted number of Metrics: Azure Monitor allows only a limited number of metrics per alert rule. This means, if you want to monitor Logic Apps on a larger number of metrics, you will need to configure multiple alert rules accordingly.
Lack of Metric Dashboard across Regions: This hinders the ability to have a consolidated view of metric data for Logic Apps deployed in different regions.
Manual Recovery from Downtimes: Azure Monitor does not offer automatic recovery capabilities to bring Logic Apps back to the expected status in case of downtimes or failures.
Limited Notification Channel Support: It has only a restricted range of notification channels available, limiting the options through which you can receive alerts.
Several enterprise-grade monitoring solutions are available in the market to address the limitations mentioned. One such is Serverless360, an advanced cloud management platform designed explicitly for Azure.
Serverless360 is an advanced Azure Logic App monitoring tool, that provides offerings that go beyond what native Azure monitor provides. It mainly consists of four modules to facilitate Azure management and monitoring, each serving a distinct purpose: Holistic Monitoring, End-to-End Tracking, Cost Management, and Documentation Generation for Azure environments.
Keeping that aside, now let’s look into the features that make the platform stand out when it comes to Azure Logic Apps:
When trying to monitor Logic Apps on a huge number of metrics, a limitation to consider is that a single alert in Azure Monitor can only accommodate up to 5 conditions. You may need to set up multiple alerts to cover all the required metrics. This can potentially lead to an increased number of alerts and a higher risk of alert fatigue.
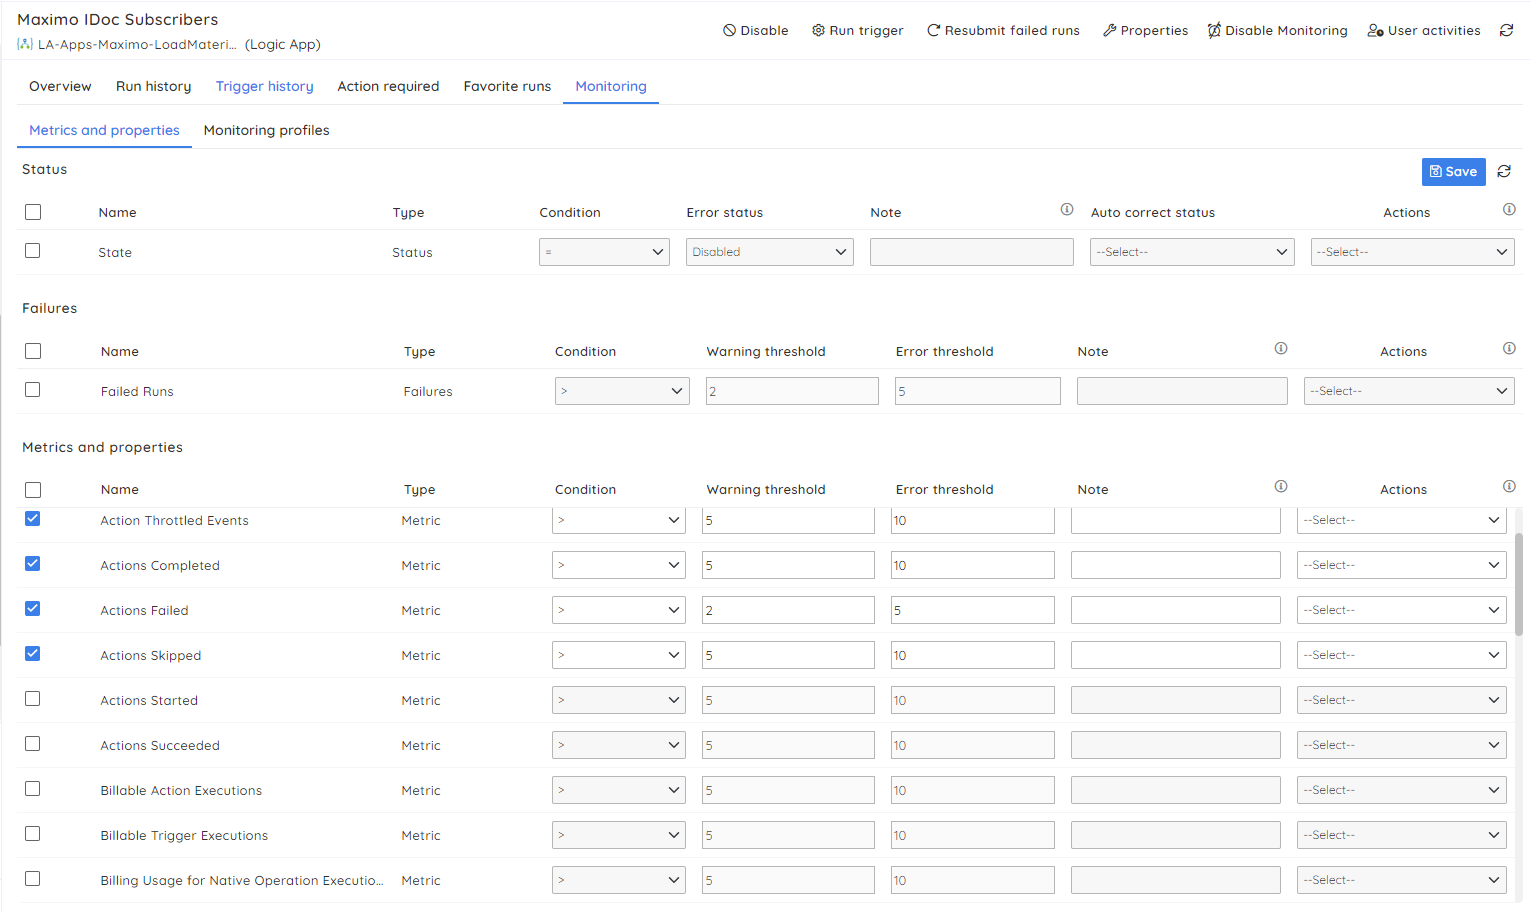
Serverless360 can be valuable in such situations. With that, you can monitor a wide range of metrics in a single alert at no additional cost and get a consolidated report with insights on Logic App performance, availability, status, and more.

Relying on Azure Monitor's error-based alerts may cause delays in identifying and resolving Logic App failures. However, using Serverless360 can help you establish a proactive monitoring approach by setting up warning alerts and receiving notifications before reaching the maximum error threshold.
It allows us to compare corresponding metrics such as Runs Succeeded Vs Runs Failed and get warning alerts based on the conditions set.

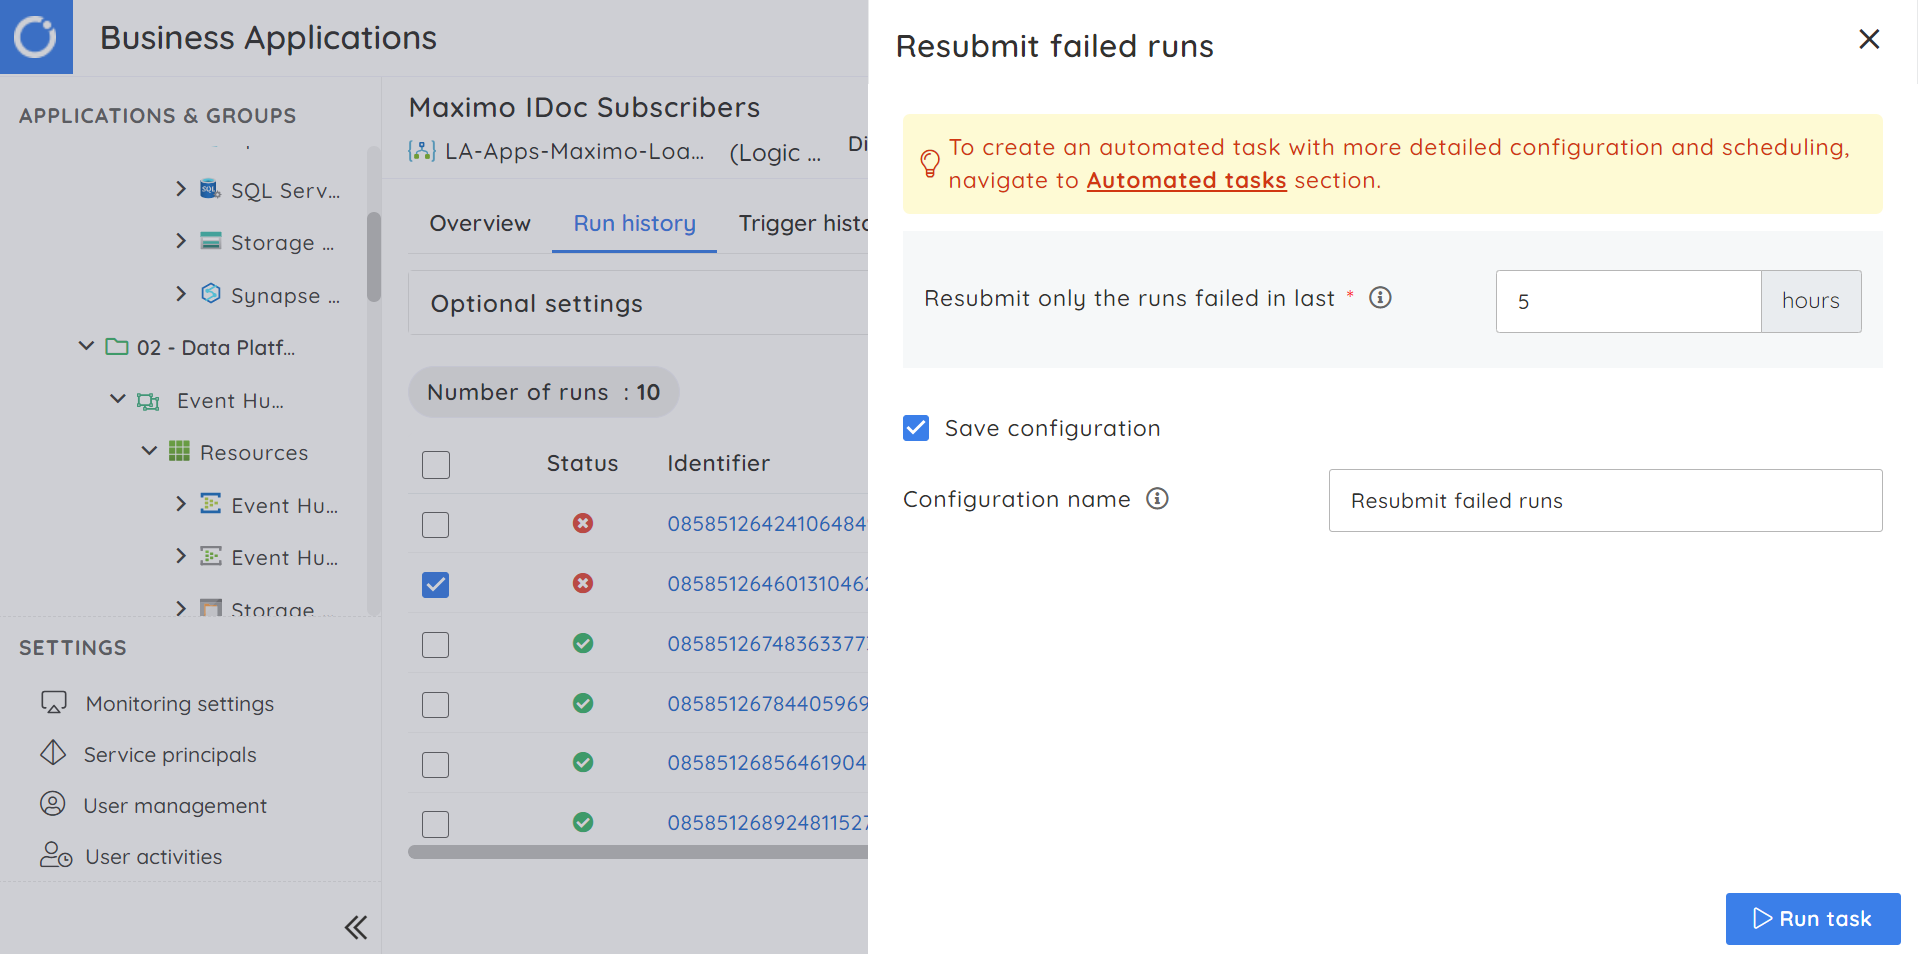
Logic App failed runs can be quickly accessed and reprocessed with Serverless360, where each failed run will be resubmitted with the same inputs and triggers as the original one. Additionally, a tag containing the details of the parent run is added to the resubmitted runs, providing the correlation between the parent and child runs.

Out-of-box features for efficiently handling the failed Logic App runs:
Automated resubmission: Automatically resubmit multiple failed Logic App runs based on the failure reasons or specified aggregation period.
Consolidated view of failed runs: View all the failed runs that require immediate remedial action in a single tab, making it easy to identify and address issues efficiently.
Run history and details: Access the run history of a particular Logic App workflow and obtain in-depth information such as run triggers, actions, inputs, etc.
Monitoring and alerts: Get to monitor Logic App failed runs and receive alerts whenever a violation breach occurs, ensuring timely resolution of issues.
It is now possible to auto-correct the health status of your Logic Apps without requiring manual intervention. For instance, if the resource gets disabled accidentally, Serverless360 supports to auto-enable the Logic App and restoring its active status.

The platform also offers automated actions when a threshold violation occurs. For example, if you want to resubmit failed Logic App runs when the count reaches 5, there are options to automate the entire process. On setting up appropriate actions, it can detect the violation and auto-initiate the resubmission of the intended runs.
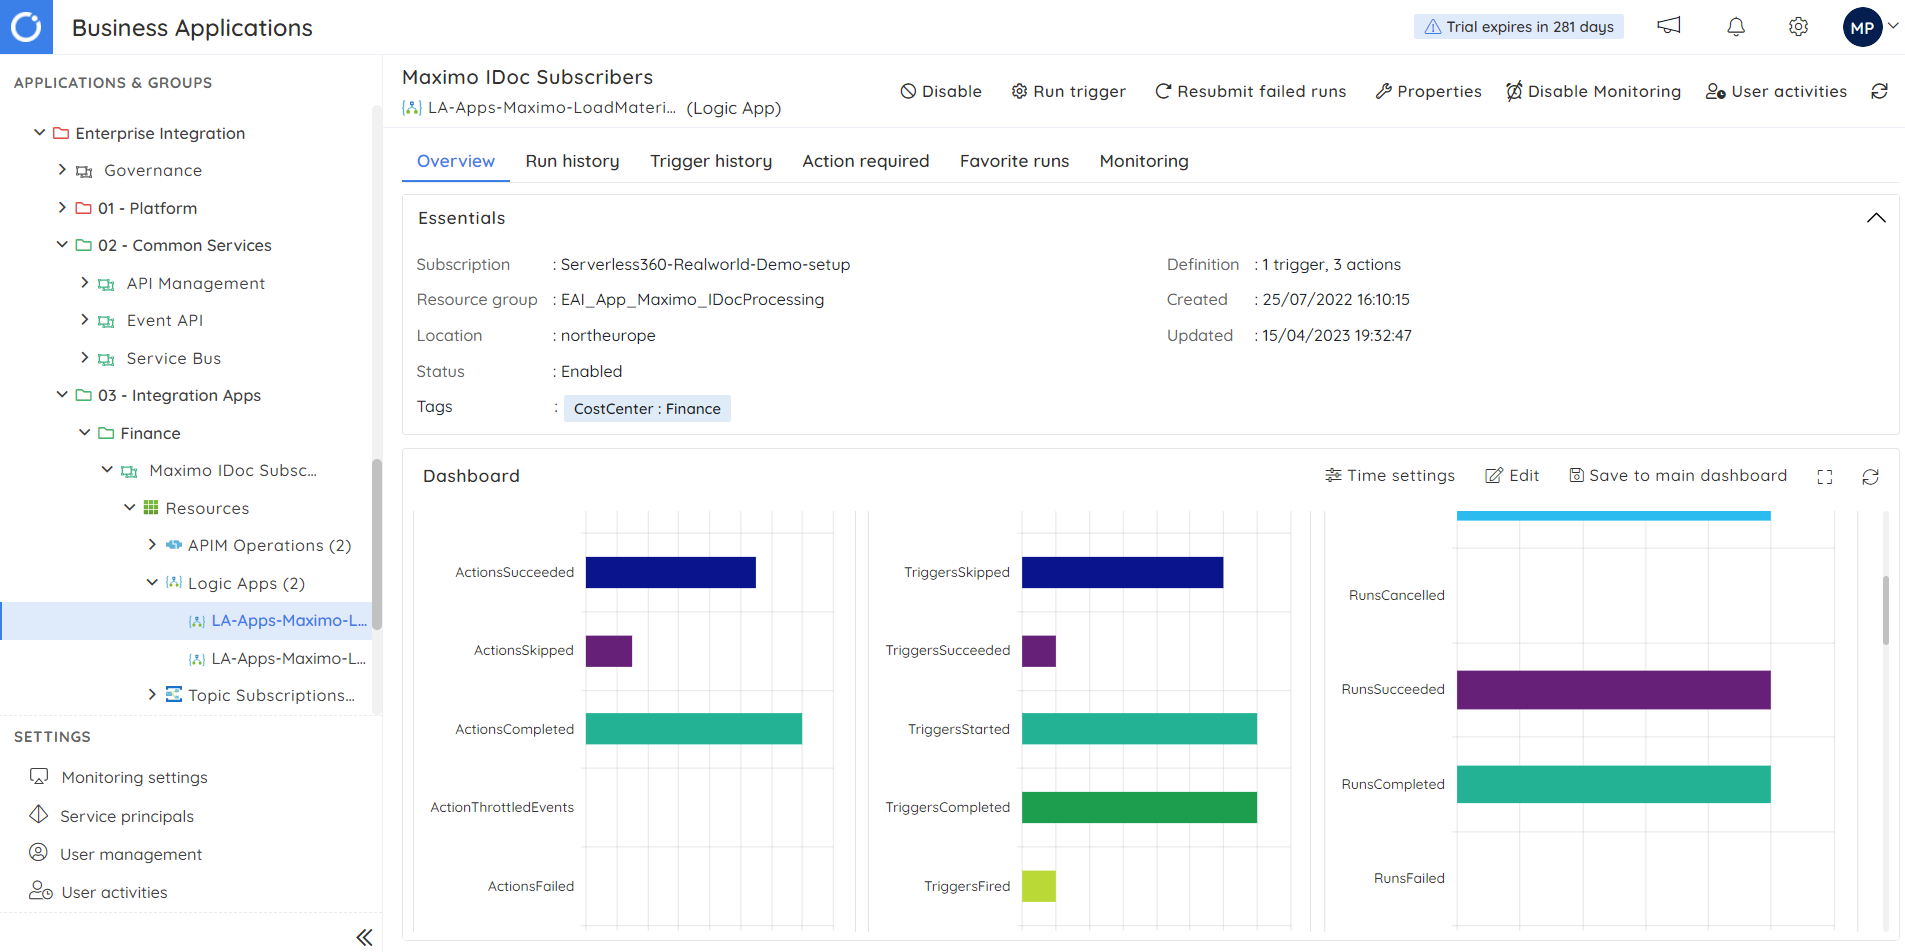
You can choose and arrange various charts, graphs, and widgets to display key metrics such as success rates, failure rates, resource utilization, and more. This customizable dashboard provides a clear and intuitive way to gain insights into the performance and health of multiple Logic Apps.

Get a holistic view of all your Logic Apps across Subscriptions and regions from an application context. With this, you can visualize how the services are interconnected with each other, providing insights into the overall architecture and dependencies. There are color indications incorporated to represent the health status of individual Logic Apps.

In scenarios where an application workflow involves multiple Logic Apps, achieving Azure Logic Apps correlation and end-to-end tracking becomes crucial to troubleshoot failures. For instance, when a message passes through five Logic Apps to complete a specific business process, it will be essential to determine if all the stages were successfully executed and this can be effortlessly achieved using Serverless360 BAM.

There are options to enable granular access control and comprehensive auditing capabilities. With these, users can manage permissions and set up access to Logic Apps, ensuring that only authorized individuals can perform specific actions. The platform also logs all the activities performed on Logic Apps via Serverless360.

All these features are applicable to both Logic App resource types (Consumption and Standard).
This blog emphasizes the importance of adopting a proactive approach to monitor Azure Logic Apps. It identifies the limitations of native Azure monitoring tools and highlights how Serverless360 can overcome these challenges with its support for consolidated monitoring, intelligent automation, reprocessing capabilities, message tracking, and more.
Thank you for visiting our website!
We value your engagement and would love to hear your thoughts. Don't forget to leave a comment below to share your feedback, opinions, or questions.
We believe in fostering an interactive and inclusive community, and your comments play a crucial role in creating that environment.